1. Summary of findings
This report measures the United States space economy from the buyer's side. It reads every unclassified federal contract action that the Federal Procurement Data System (FPDS) published for a defined set of space related codes, from FY2016 through FY2026. It counts what agencies committed to buy, how they bought it and from whom. It does not estimate anything. Every figure in it is computed from 41,887 raw feed pages held on disk, and a separate program recomputes the headline figures from those pages with a different parser.
The study holds 413,031 unique contract actions after overlaps are removed. Two views run through the report. The full scope covers every action under five industry codes and two product codes. It totals $433.54B in net obligations. The space only cut keeps actions coded as space vehicles (PSC 18) or space research and development (PSC AR). It totals $125.90B across 147,543 actions. The full scope carries missile and communications spending that is not space, so every claim about space in this report rests on the space only cut unless it says otherwise.
The main findings follow.
- Space demand is flat in nominal terms. Space only obligations were $11.94B in FY2016 and $11.69B in FY2025, the last closed year. The peak was $12.69B in FY2023. Because these are nominal dollars, a flat line is a real decline.
- One buyer dominates. NASA placed 88.9% of space only obligations. The buyer HHI for the space only cut is 8,009 on a scale to 10,000.
- Seller concentration is high but lower than buyer concentration. In the space only cut the top five vendor keys took 53.4% of dollars and the seller HHI is 702. In the full scope the top vendor alone took 30.8%.
- Set asides collapsed in the space only cut. The share of space only new awards reserved for small firms was 68.0% in FY2016 and 7.4% in FY2026. Yet small firms' share of space only dollars was 5.7% in FY2016 and 10.9% in FY2026.
- Big awards hold most of the money. In the full scope, 151 new awards above $100 million held 54.1% of all new award dollars, while the median new award was $21,344.
- Competition is thinning. In the space only cut the single offer share of competed new awards was 5.4% in FY2016 and 36.5% in FY2026.
- Newer firms are winning more of what is competed. In the space only cut, firms first seen within five years won 47.6% of competed new awards in FY2024 to FY2026. This is an upper bound.
- Space work is cost type work. 79.2% of space only dollars sit on cost type contracts, against 35.2% in the full scope.
- Geography clusters. 36.7% of space only dollars are performed in CA. The top ten states hold 82.8%.
- Launch is the largest theme. Of the six frontier themes, launch and in space transportation carries the most space only money, $23.25B. In space manufacturing and servicing carries $0.06B.
The record has limits. Classified awards and other transaction agreements (OTAs) are not in FPDS. FY2026 was pulled before the Department of Defense reporting lag had run out. Dollars are nominal. Vendor age is a proxy. Themes are found by keywords in free text. Section 11 sets these out in full.
2. Why measure demand
Most public pictures of the space economy come from the supply side. They add up what firms earn, what launches fly and what investors put in. Those are useful numbers. They also share a weakness. They describe sellers, and much of what they describe is reported by the sellers themselves.
The federal government is the largest single buyer of space goods and services in the United States. Its buying is recorded, action by action, in a public system. That record lets us ask questions that supply side accounts cannot answer well. How much did government commit to buy each year? Was the buying open to competition? How many firms answered? Which agencies did the buying? Which firms won, and were any of them new?
A demand side measure has three uses. First, it is a check. If supply side accounts show growth that the buyer's record does not, the gap needs an explanation. Second, it shows market structure: how concentrated buyers and sellers are, and how contracts are priced. Third, it can be repeated. The same rules applied to next year's records give next year's figures, with no survey and no model.
This report is narrow on purpose. It measures one buyer, the federal government, through one record, FPDS. It does not try to size the space economy. It tries to measure one side of it well.
3. Data and method
Source
The source is the FPDS public ATOM feed, a machine readable list of contract action records. The study sent one query per code family and fiscal year and pulled every page of each query. 41,887 pages were fetched between 2026-10-13T20:07:11Z and 2026-10-13T21:02:44Z. Every page is logged with its URL, time, byte count and SHA256 fingerprint. The log itself has the fingerprint 482c82273d505c39417c3d9fe9f1c9b3e75ab0c38e488f71b04ff41856b5c7ab.
The feed returned 418,428 records. Because one action can match both an industry code and a product code, the same action can appear in two queries. Removing those overlaps leaves 413,031 unique contract actions.
Scope
The full scope is every action, new or modified, signed from 1 October 2015 to 30 September 2026, whose principal industry code (NAICS) is 336414 (guided missile and space vehicle manufacturing), 336419 (other guided missile and space vehicle parts), 334220 (radio and wireless communications equipment), 517410 (satellite telecommunications) or 927110 (space research and technology), or whose product or service code (PSC) begins with 18 (space vehicles) or AR (space research and development).
The space only cut keeps actions whose PSC begins with 18 or AR, whatever their industry code. It is the series to use for claims about space. The full scope is wider and carries missile programs and general communications equipment.
Rules
The rules below were fixed before any figure was computed. They are the same rules printed in the study results file.
- Fiscal year is the federal year of the signed date, October to September.
- Obligated dollars are the sum of obligatedAmount over every action signed in the period, including modifications and deobligations. They are nominal.
- New awards are actions with modification number 0.
- Competed means extentCompeted code A, D, E, F or CDO. The competed share is over new awards that report the field. The single offer share is over competed new awards with an offer count of one or more.
- Buyer is the contracting sub tier agency. Buyer concentration uses agencies with positive net obligations. HHI is the sum of squared percentage shares.
- Vendor is the ultimate parent UEI, else the UEI, else the DUNS number, else the upper cased name.
- Newer firm is a vendor whose first in scope action in this dataset falls in the current fiscal year or the four before it. It is reported from FY2021 onward.
The extension in this report adds seven blocks, each defined before its numbers.
- Sellers. Top vendor share, top five share and seller HHI over vendors with positive net obligations, and a count of distinct vendors. Vendor keys with the same or similar names are not merged.
- Set asides and small business. The share of new awards, and of their dollars, carrying any set aside other than NONE, among new awards that report the field. The share of new awards, and of all dollars, where the contracting officer judged the vendor a small business.
- Award size. The median and 90th percentile obligation on new contracts and orders (IDVs excluded, since they rarely carry money at award), by the nearest rank rule, and the share of new award dollars in awards above $100 million.
- Place of performance. Dollars by the principal place of performance state; places outside the United States and blanks are kept apart. State HHI is over US places with positive net obligations.
- Agency series. Dollars by fiscal year for the six largest contracting agencies in each view.
- Pricing groups. Fixed price, cost type, and other or not reported, from typeOfContractPricing.
- Themes. Six frontier market themes, each defined by a PSC list and a keyword list applied to the description field. Section 10 prints each rule.
Verification
Two checks stand between the raw pages and any figure here. The first is completeness: for every code and year, the entries on disk are compared with the total the feed reports. All slices matched. The second is recomputation. A separate program parses the raw pages with a standard XML parser rather than the pattern matching used by the study, verifies every page fingerprint, recomputes every headline in the results file, including each new block and each theme total, and prints pass or fail. It printed pass for this edition.
4. The eleven year series
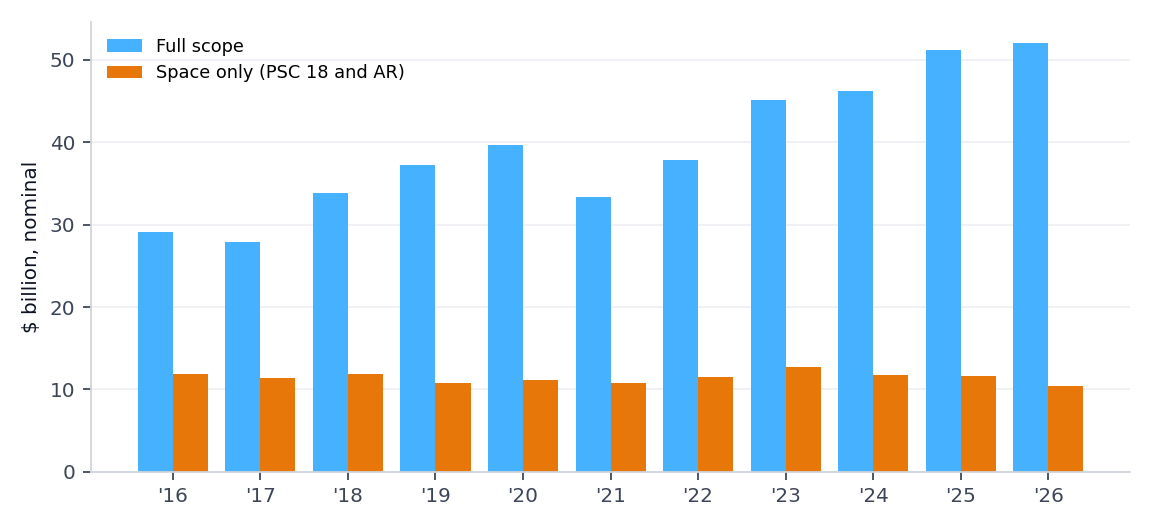
Space only obligations sit in a narrow band. They were $11.94B in FY2016, $11.11B in FY2020 and $11.69B in FY2025. The lowest year was FY2026 at $10.37B; the highest was FY2023 at $12.69B. FY2026, still incomplete when pulled, stands at $10.37B.
The full scope moves differently. It rose from $29.13B in FY2016 to $51.26B in FY2025 and $52.05B in FY2026 as pulled. Almost all of that growth is outside the space product codes. In FY2016 the product codes outside 18 and the A families, that is numeric product codes, took 44.9% of full scope dollars. In FY2026 they took 65.5%. That category is dominated by missiles and communications hardware.
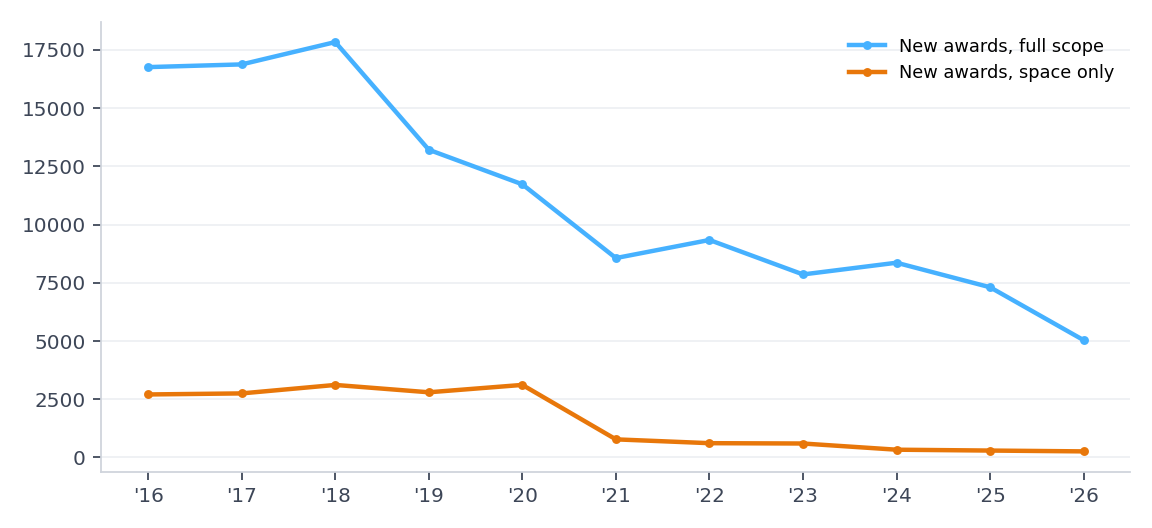
Counts tell a second story. New space only awards numbered 2,706 in FY2016 and 3,116 in FY2020, then 778 in FY2021 and 297 in FY2025. Full scope new awards fell from 16,761 to 7,308 over the same span. The drop from FY2021 is sharp. It may reflect a change in buying, or a change in how agencies record orders. The record alone does not settle which, so shares that rest on award counts after FY2020 should be read with care.
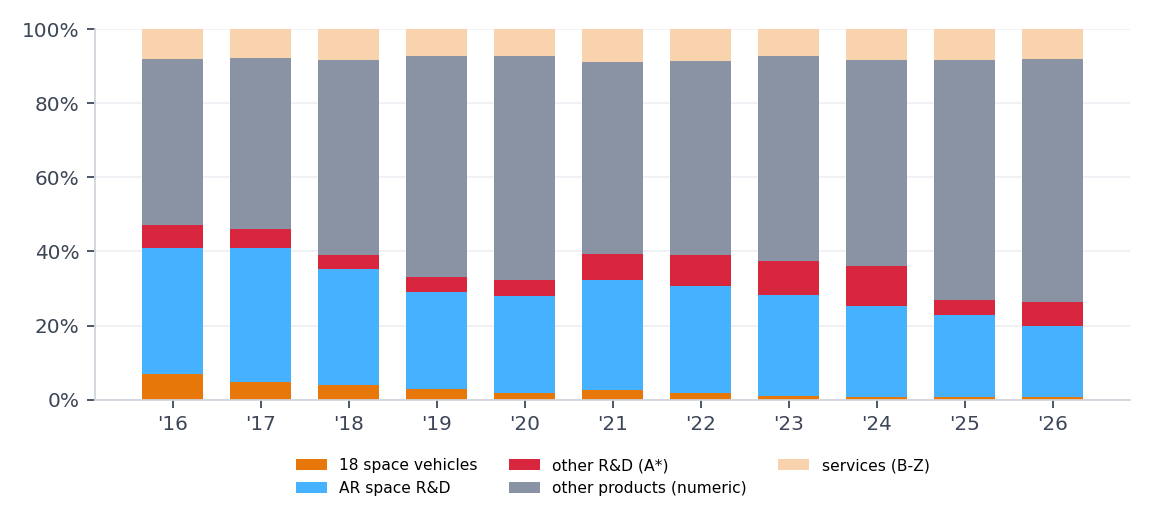
Within the space only cut, research and development dominates. The AR codes took 82.9% of space only dollars in FY2016 and 96.7% in FY2026. Space vehicles (PSC 18) fell from 17.1% to 3.3%. Federal space hardware is increasingly bought as research and development, or bought outside these product codes, or bought through instruments that FPDS does not record.
5. Competition
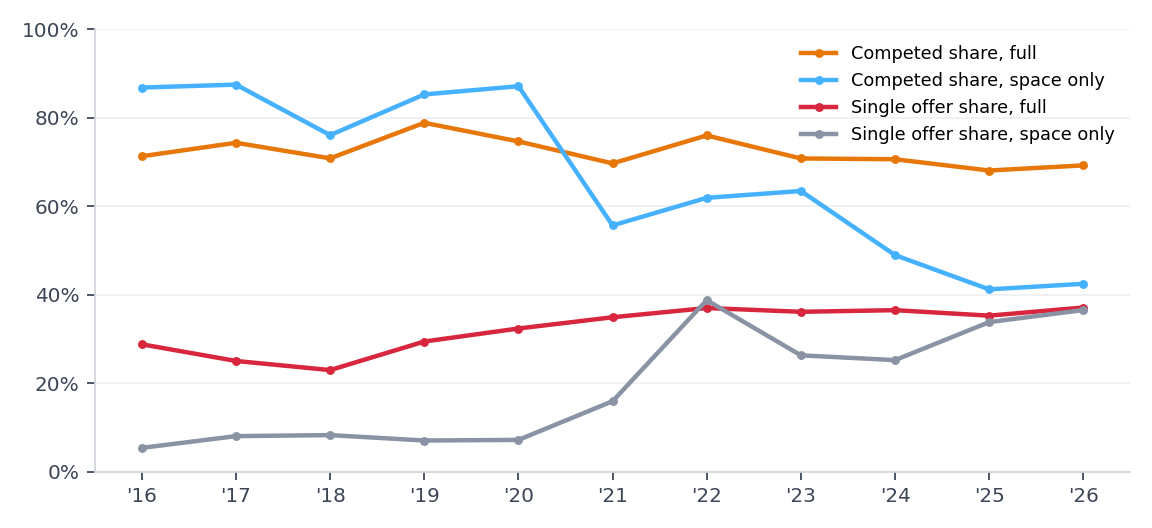
Over all years, 72.7% of full scope new awards were competed, and 79.5% in the space only cut. Competition in name is common. Competition in practice is thinner. In the full scope, 30.3% of competed new awards with an offer count drew a single offer (n = 68,075).
The trend is the more telling figure. In the full scope the single offer share was 28.8% in FY2016 and 37.0% in FY2022, and stayed near that level, at 37.1% in FY2026. In the space only cut it was 5.4% in FY2016 and 36.5% in FY2026. The space only competed share fell from 86.8% in FY2016 to 42.5% in FY2026.
Both measures rely on fields that agencies fill in. Task orders inherit conventions that vary by agency, and offer counts are missing on some competed awards. Those awards are left out of the single offer denominator rather than guessed.
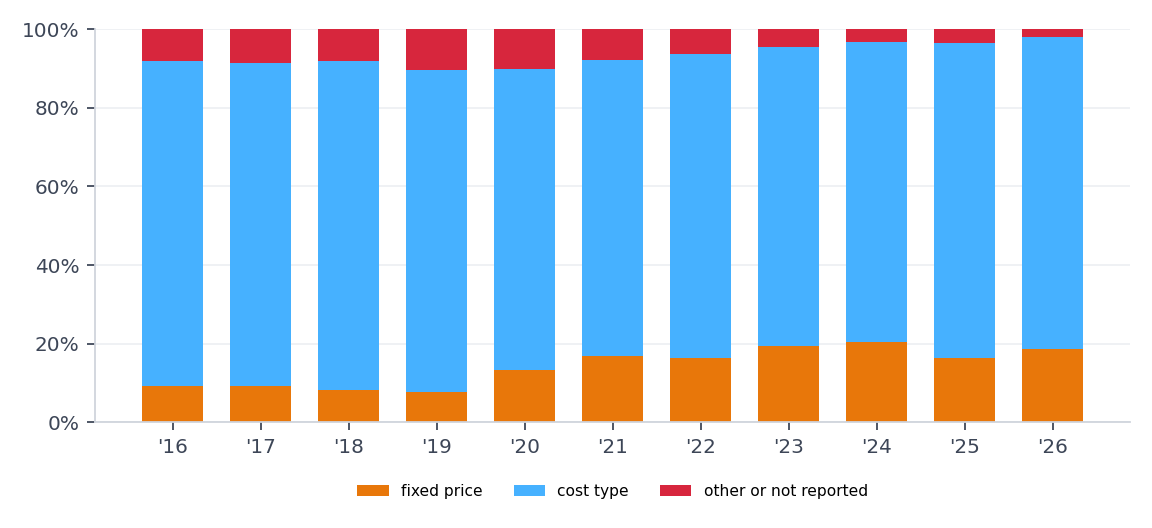
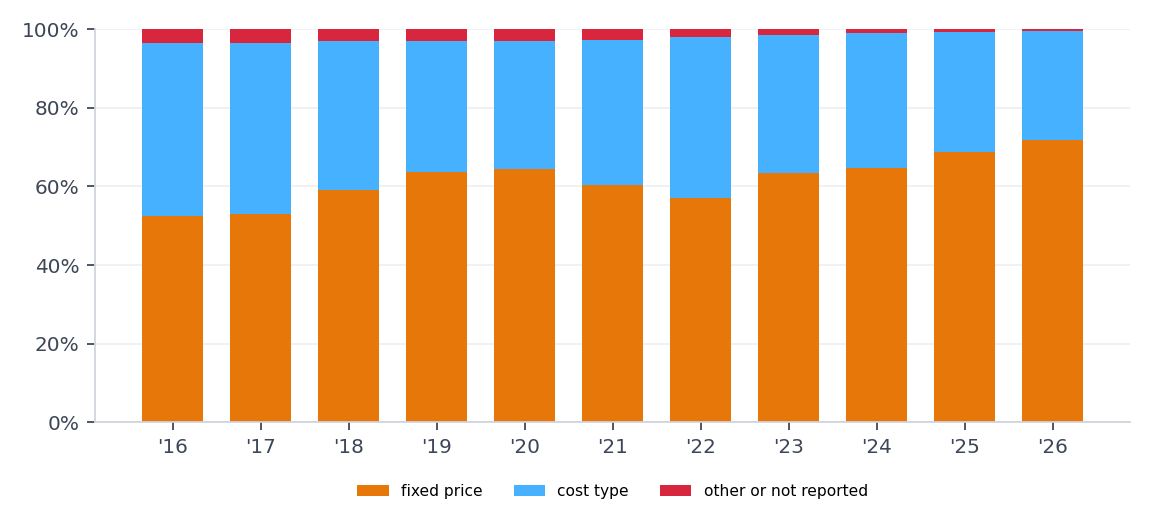
Pricing type is a second lens on competition and risk. In the space only cut, 79.2% of dollars sit on cost type contracts and 14.2% on fixed price. The full scope is the reverse: 62.8% fixed price and 35.2% cost type. Fixed price work in the space only cut rose from 9.2% of dollars in FY2016 to 20.3% in FY2024 and 18.6% in FY2026.
6. Buyers
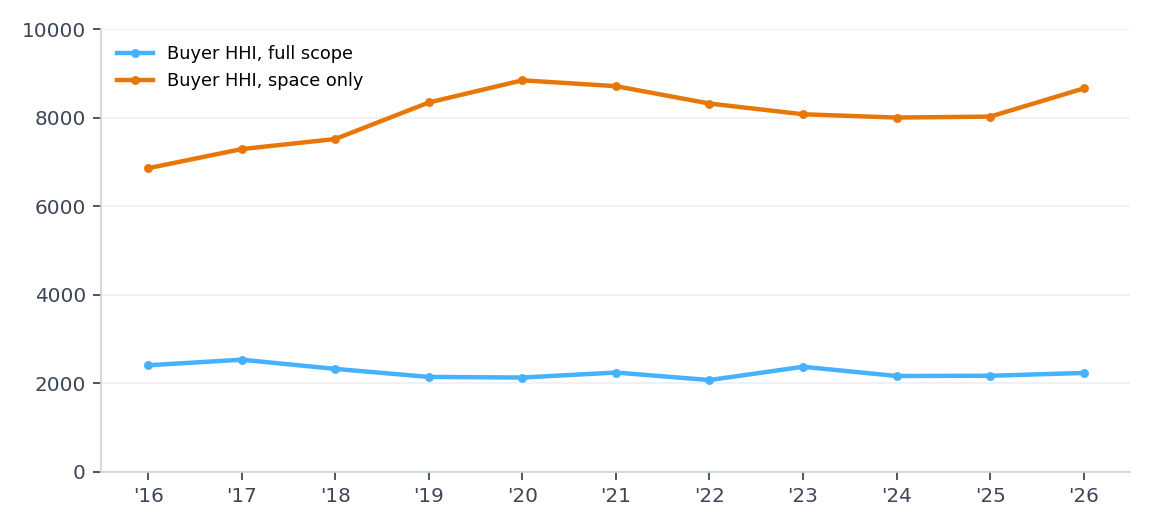
NASA is the space market's buyer of record. It placed 88.9% of space only obligations among agencies with positive net obligations, and the top three agencies placed 99.7%. The space only buyer HHI is 8,009. By the usual antitrust reading, any figure above 2,500 is highly concentrated, and this is far above it. In the full scope NASA's share is 29.4% and the HHI is 2,165.
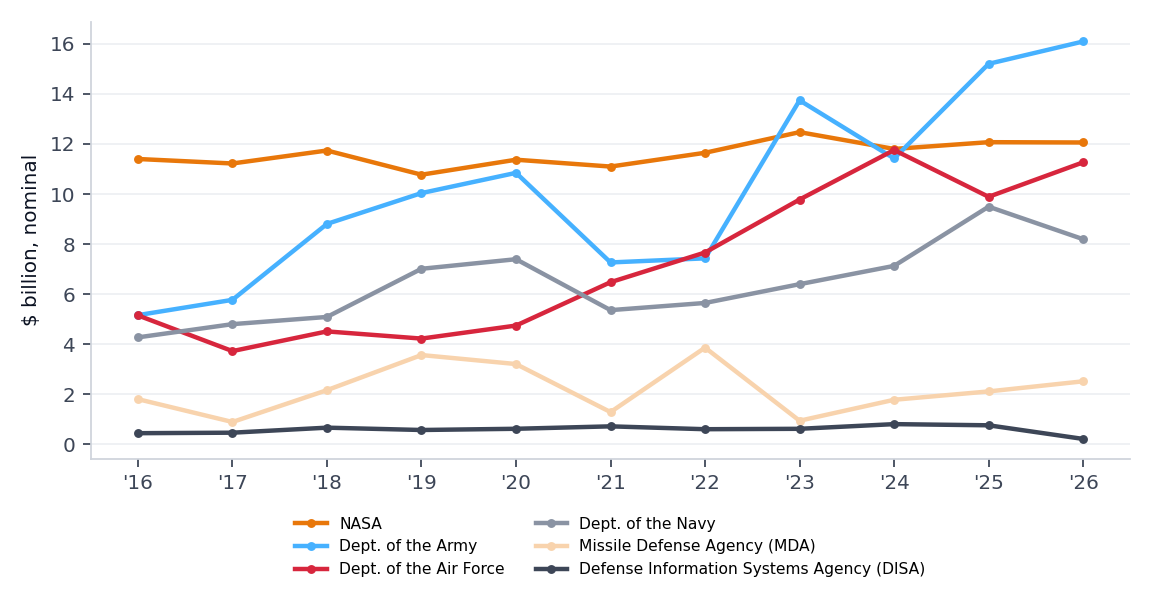
The six largest buyers in the full scope are, in order, NASA, Dept. of the Army, Dept. of the Air Force, Dept. of the Navy, Missile Defense Agency (MDA), Defense Information Systems Agency (DISA). NASA obligated $11.40B in full scope actions in FY2016 and $12.07B in FY2025. The Army obligated $5.16B in FY2016 and $15.20B in FY2025, which is why it became the top full scope buyer in three recent years. That growth is missile and communications work, not space.
In the space only cut the order is NASA, Dept. of the Air Force, Dept. of the Navy, Energy, Department of, Federal Acquisition Service, Defense Microelectronics Activity (DMEA). The Air Force, which contracts for the Space Force, obligated $2.17B in space only actions in FY2016 and $1.08B in FY2025. National security space is not small. It is mostly bought outside the space product codes, through classified awards, or through OTAs, none of which this cut can see.
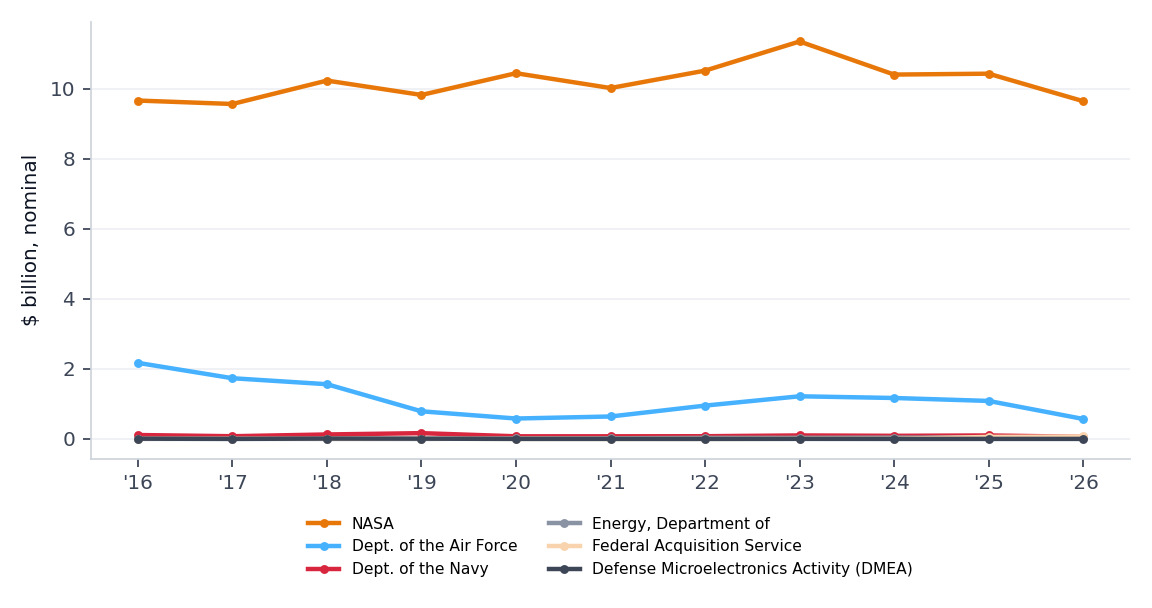
The buyer is the contracting office, not the funding agency. When one agency buys on behalf of another, the dollars sit with the office that signed.
7. Sellers
The full scope has 9,364 distinct vendor keys; the space only cut has 2,417. The space only count fell from 1,047 in FY2016 to 589 in FY2025.
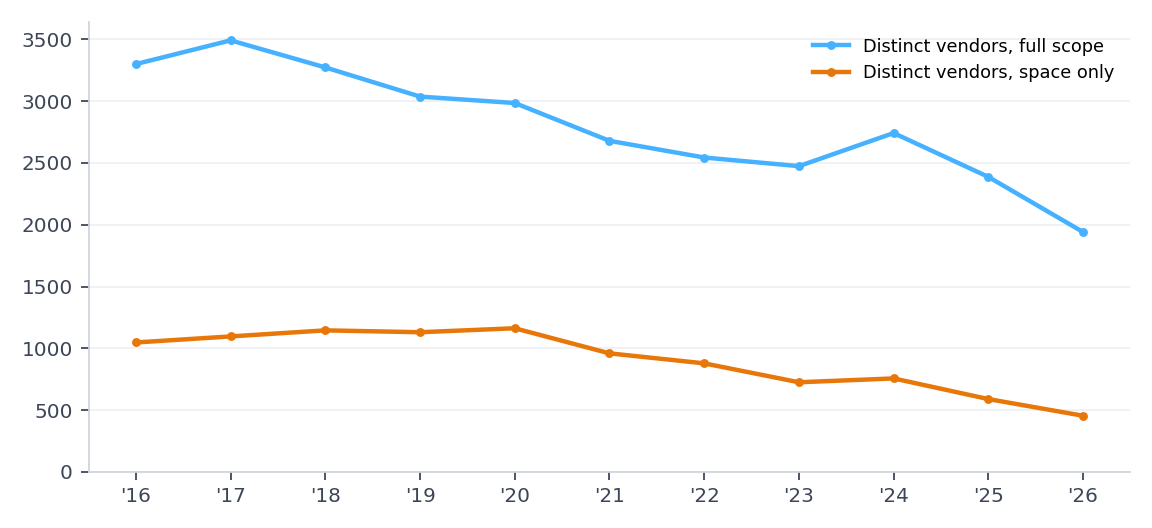
Concentration among sellers is high in the full scope. The top vendor key, Lockheed Martin Corporation, took 30.8% of dollars. The top five took 57.8%. The seller HHI is 1,202.
In the space only cut the top vendor key is the operator of NASA's Jet Propulsion Laboratory, a federally funded research and development center, with 16.8%. The top five took 53.4% and the seller HHI is 702. Space only seller HHI was 1,125 in FY2016 and 528 in FY2024.
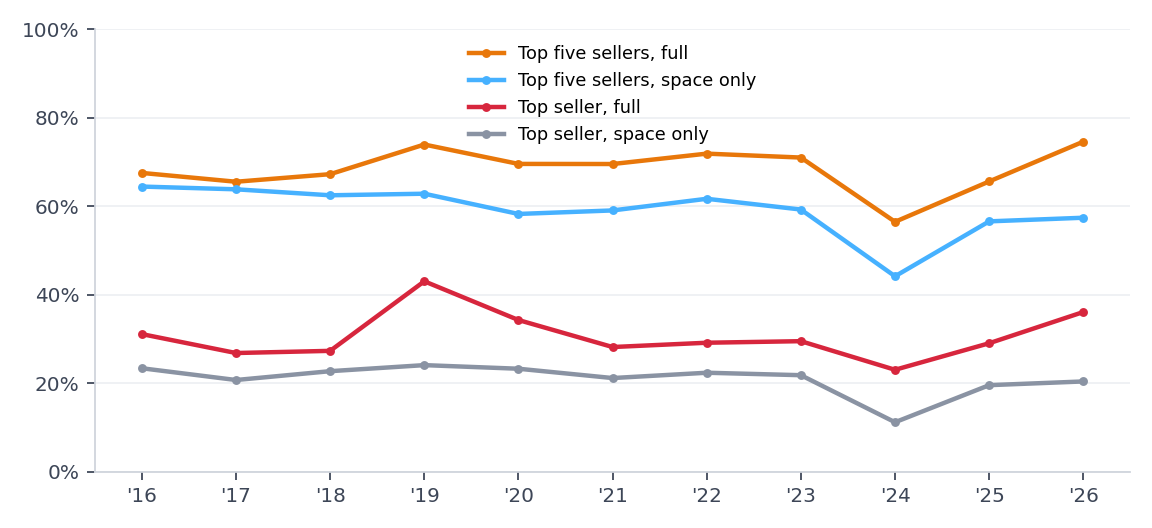
Duplicate names are not merged. The same company can hold two vendor keys when its parent identifier changed or a subsidiary reports under another parent. In the full scope the top five keys include Raytheon Company twice. In the space only cut the research center operator appears twice. Merging would raise the measured concentration. These seller figures are therefore a floor on true concentration, not a ceiling.
Small business and set asides
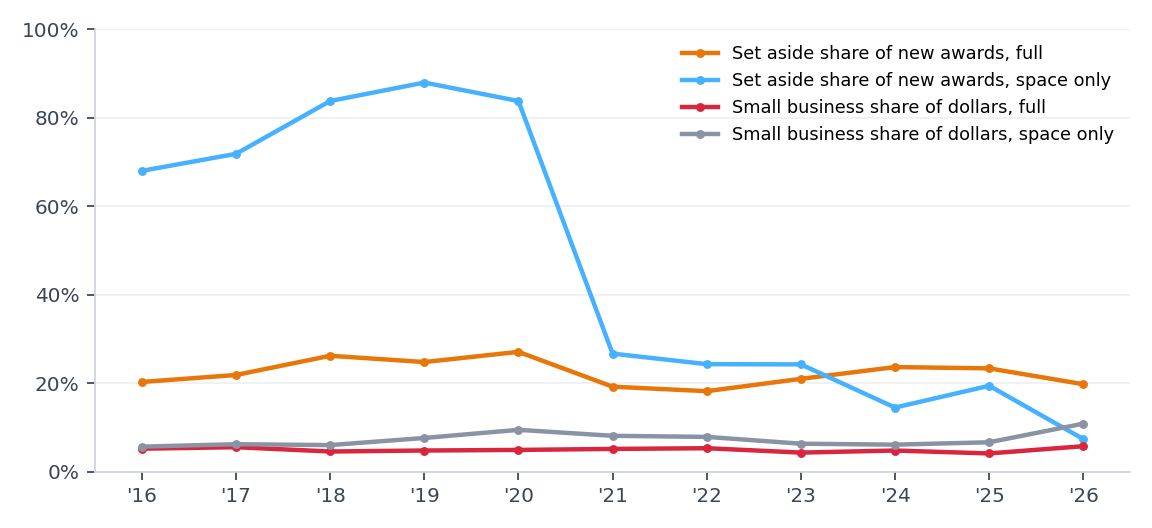
Small business is common by count and rare by dollars. In the full scope, contracting officers judged the vendor small on 50.8% of new awards, but small firms took 5.0% of dollars. In the space only cut the figures are 26.3% and 7.3%.
Set asides tell a sharper story. In the space only cut, 68.0% of new awards reporting the field were set aside in FY2016 (n = 965), and 87.9% in FY2019. From FY2021 the share fell to 26.7%, and to 7.4% in FY2026 (n = 54). The number of new awards reporting the field fell with it. Much of the earlier volume was small research awards, and the fall coincides with the drop in recorded new awards after FY2020. Small firms' share of space only dollars did not fall: it was 5.7% in FY2016 and 10.9% in FY2026.
Award size
The typical award is small and the typical dollar is in a big award. The median full scope new contract or order carried $21,344 at award; the 90th percentile carried $415,700 (n = 120,427). Yet 151 awards above $100 million held 54.1% of new award dollars. In the space only cut the median was $124,493 and the 90th percentile $749,734; only 4 space only awards passed $100 million at award, holding 12.4% of space only new award dollars.
The space only median rose from $121,256 in FY2016 to $403,250 in FY2026. Fewer, larger new awards is consistent with the fall in recorded award counts.
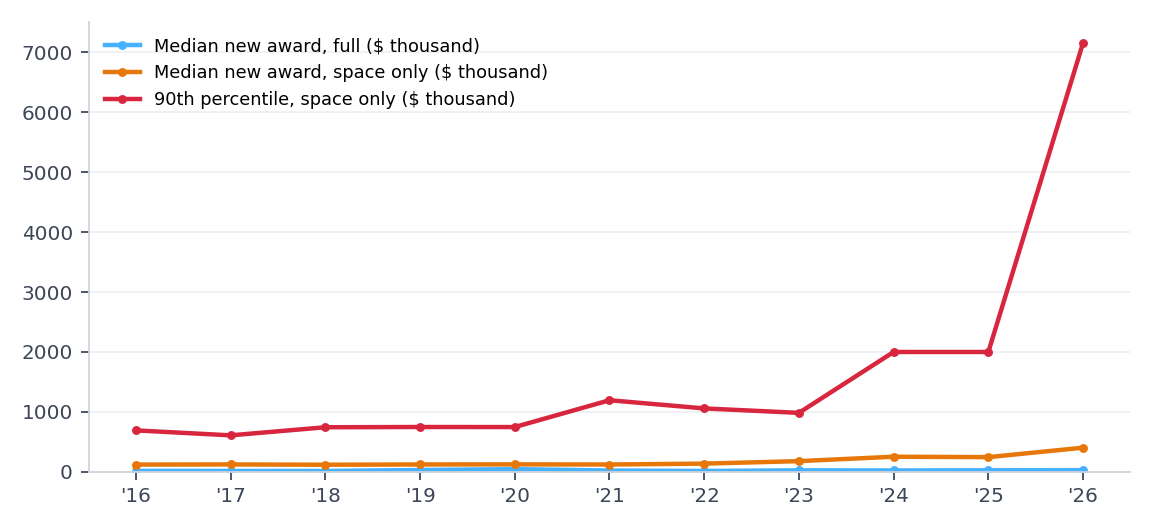
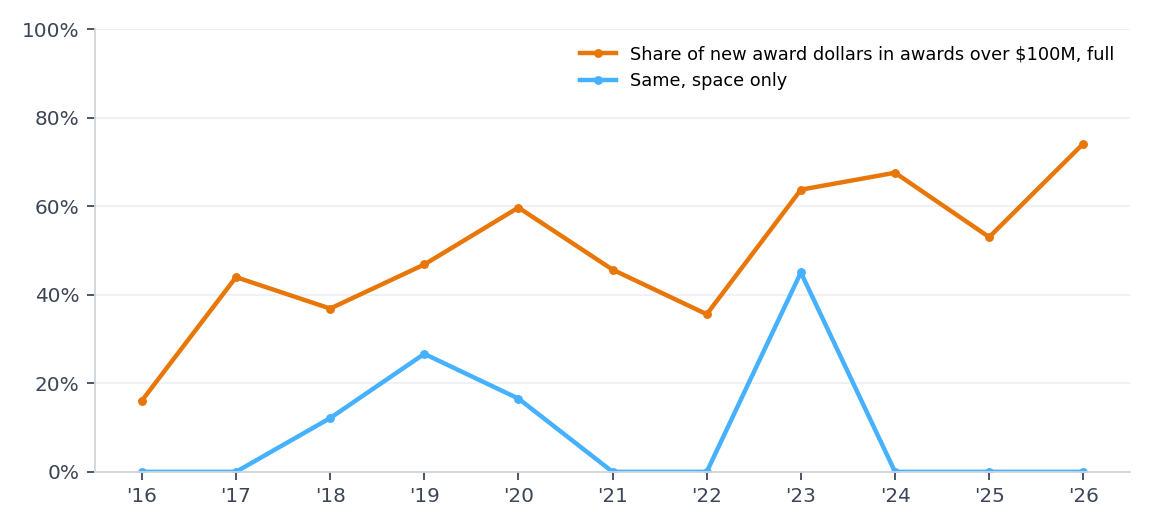
Obligation at award is often a first increment. Large programs are funded through later modifications, so award size here understates the size of programs. It measures how money is first committed, not how big contracts become.
8. Entrants
A newer firm here is one whose first action in this dataset falls in the same fiscal year or the four before. Across FY2021 to FY2026, newer firms won 28.6% of full scope competed new awards and 24.7% of their dollars. In the space only cut the figures are 27.9% and 46.1%.
The share rose in the later years. In the full scope it was 21.5% in FY2021 and 39.1% in FY2024. In the space only cut it was 24.0% in FY2021 and 52.7% in FY2026. Pooled over FY2024 to FY2026, newer firms won 47.6% of space only competed new awards and 44.0% of their dollars.
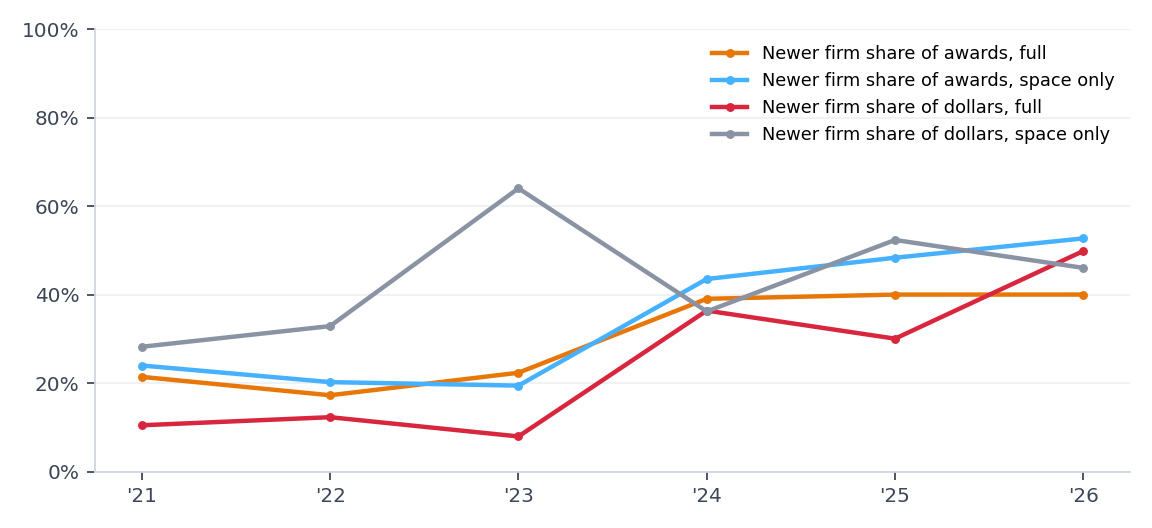
This is an upper bound. The dataset starts in FY2016 and covers only these codes, so a firm with decades of federal work elsewhere can count as new here. Name only vendor keys can split one firm in two, which also raises the share. The later rise also rests on smaller award counts after FY2020. Read it as a sign that the space market is reaching firms it had not dealt with under these codes, not as a count of new companies.
9. Geography
Place of performance is where the work is mainly done. In the space only cut, CA hosts 36.7% of dollars, followed by CO at 10.6% and AL at 10.4%. The top ten states hold 82.8%. The state HHI is 2,082. Places outside the United States hold 0.2%, and 9.6% has no place recorded.
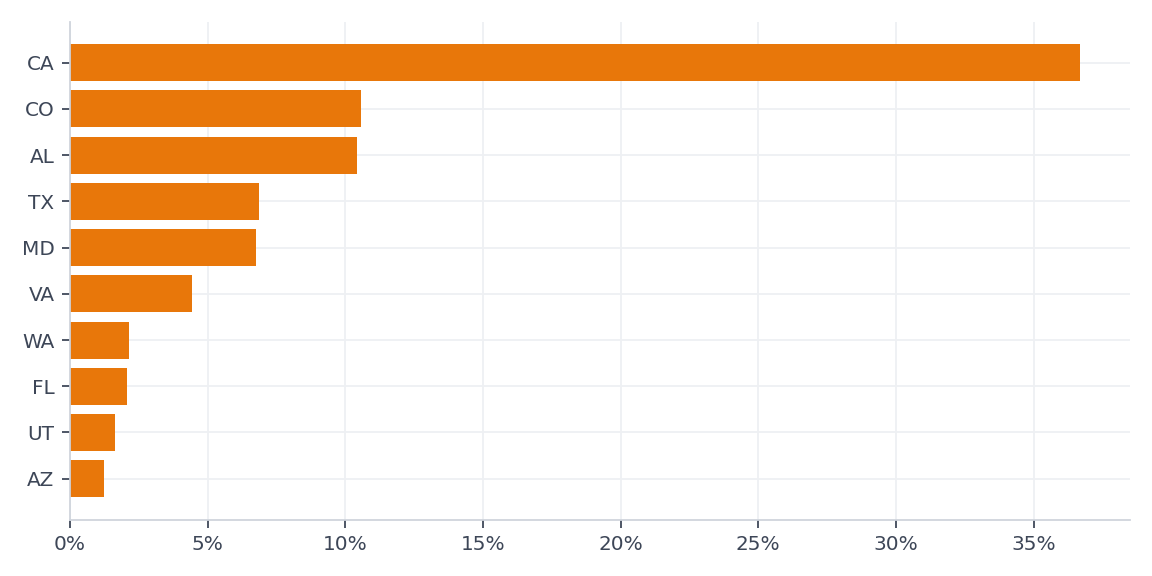
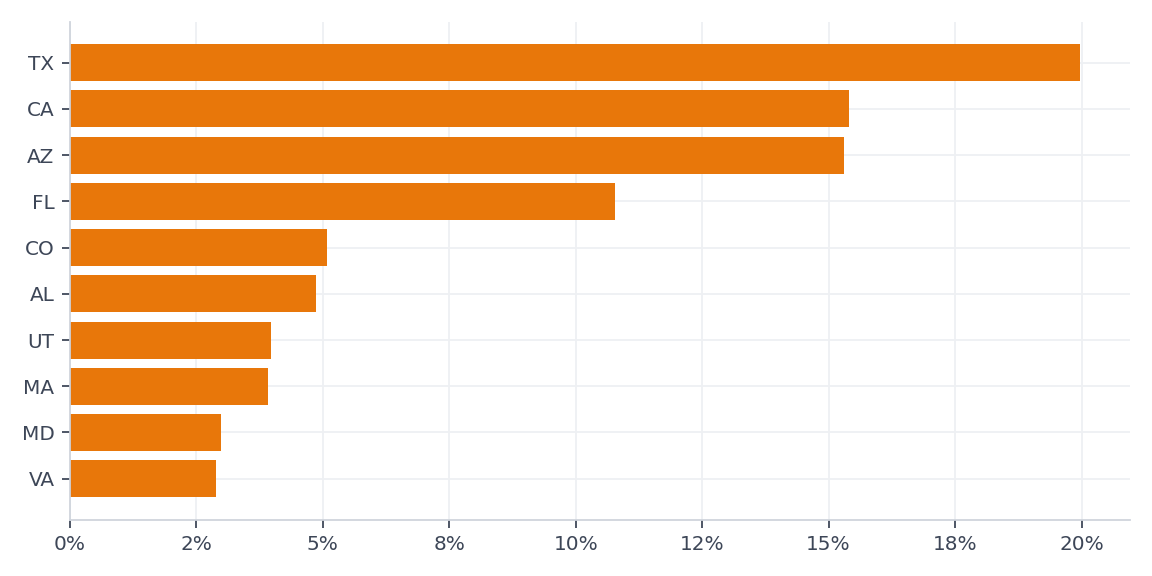
The full scope map is different. TX leads with 20.0%, then CA with 15.4% and AZ with 15.3%. Missile production sites drive these shares. The full scope state HHI is 1,216.
The space cluster has held its shape. CA was the top space only state in FY2016 with 40.8% and CA in FY2026 with 31.2%. A prime contractor with plants in several states is coded once, at its main site, so the true spread of work is wider than these shares.
10. Themes
The themes below follow the markets that frontier space investors and analysts track. Each theme is a rule printed before its numbers. An action is in a theme if its PSC is on the theme list or if its description field contains one of the theme phrases as whole words, after the field is upper cased and every character other than a letter or digit is turned into a space. Themes overlap: one action can sit in two.
The keyword method has limits that matter. The description is free text written by contracting staff. It is often short, sometimes a line item code, and sometimes a research abstract. A keyword finds actions that use the word, not actions that do the thing. It misses work described only by program names and catches research that mentions a term in passing. A modification whose own description lacks the keyword falls outside the theme even if its base award is inside. Theme dollars are therefore indicative. They are not market sizes.
Earth observation and remote sensing
Rule. An action is in this theme if it carries no PSC code (none isolates this theme, so it rests on keywords alone), or if its description contains one of these phrases as whole words: EARTH OBSERVATION, EARTH OBSERVING, REMOTE SENSING, LANDSAT, IMAGERY, HYPERSPECTRAL, MULTISPECTRAL, SYNTHETIC APERTURE RADAR, JPSS, GOES R, GEOSTATIONARY OPERATIONAL ENVIRONMENTAL, WEATHER SATELLITE, SENTINEL 6.
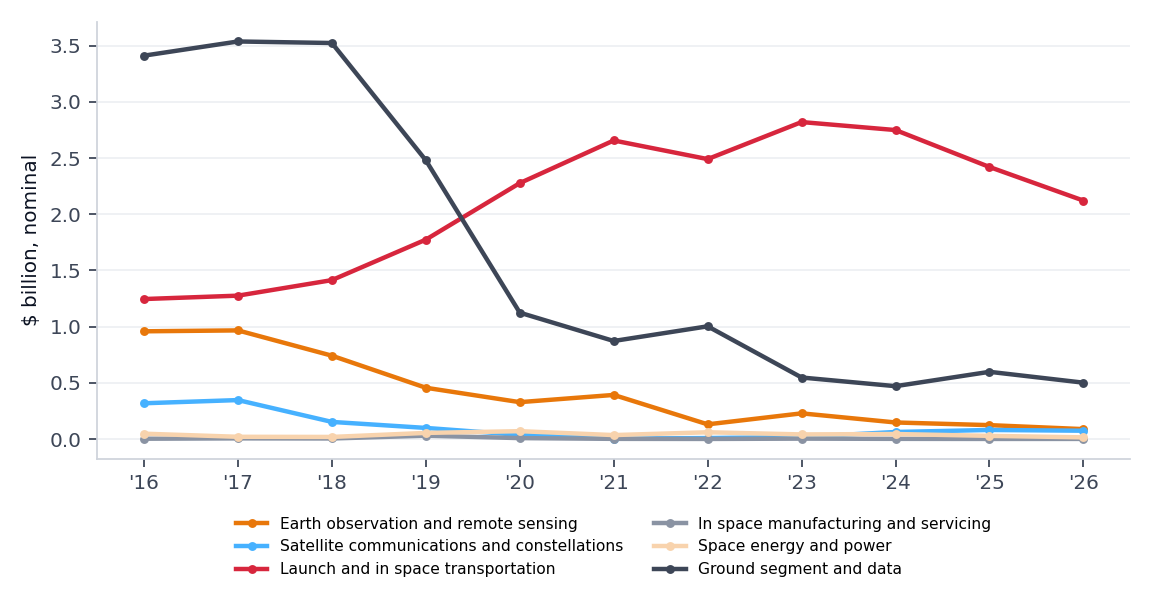
In the full scope the theme holds $6.30B over 11,415 actions and 1,400 new awards. In the space only cut it holds $4.56B over 10,830 actions. Space only dollars in the theme were $0.96B in FY2016 and $0.09B in FY2026. In the full scope, 88.8% of new awards in the theme were competed and 7.9% of competed awards with an offer count drew a single offer (n = 165). Newer firms won 19.5% of competed new awards in the theme from FY2021 to FY2026 in the full scope, and 12.9% in the space only cut. Of the full scope actions, 0 entered the theme through the PSC rule and the rest through keywords.
Satellite communications and constellations
Rule. An action is in this theme if it carries PSC DG11, 7G22, or if its description contains one of these phrases as whole words: SATCOM, SATELLITE COMMUNICATION, SATELLITE COMMUNICATIONS, SATELLITE TELECOMMUNICATIONS, SATELLITE SERVICES, CONSTELLATION, STARLINK, STARSHIELD, IRIDIUM, INMARSAT, TRANSPONDER, PROLIFERATED, MUOS, AEHF, WIDEBAND GLOBAL.
In the full scope the theme holds $11.16B over 32,186 actions and 12,685 new awards. In the space only cut it holds $1.20B over 1,323 actions. Space only dollars in the theme were $0.32B in FY2016 and $0.07B in FY2026. In the full scope, 82.1% of new awards in the theme were competed and 23.9% of competed awards with an offer count drew a single offer (n = 6,071). Newer firms won 39.9% of competed new awards in the theme from FY2021 to FY2026 in the full scope, and 38.5% in the space only cut. Of the full scope actions, 14,179 entered the theme through the PSC rule and the rest through keywords.
Launch and in space transportation
Rule. An action is in this theme if it carries PSC 1840, V126, or if its description contains one of these phrases as whole words: LAUNCH SERVICE, LAUNCH SERVICES, LAUNCH VEHICLE, LAUNCH VEHICLES, NSSL, EELV, CARGO RESUPPLY, COMMERCIAL RESUPPLY, CREW TRANSPORTATION, COMMERCIAL CREW, LUNAR LANDER, HUMAN LANDING SYSTEM, ORBITAL TRANSFER, SPACE TRANSPORTATION, SPACE LAUNCH SYSTEM.
In the full scope the theme holds $35.50B over 5,531 actions and 308 new awards. In the space only cut it holds $23.25B over 3,917 actions. Space only dollars in the theme were $1.25B in FY2016 and $2.12B in FY2026. In the full scope, 77.9% of new awards in the theme were competed and 2.5% of competed awards with an offer count drew a single offer (n = 161). Newer firms won 41.9% of competed new awards in the theme from FY2021 to FY2026 in the full scope, and 38.5% in the space only cut. Of the full scope actions, 1,031 entered the theme through the PSC rule and the rest through keywords.
In space manufacturing and servicing
Rule. An action is in this theme if it carries PSC 1850, or if its description contains one of these phrases as whole words: IN SPACE MANUFACTURING, IN SPACE ASSEMBLY, ON ORBIT SERVICING, ON ORBIT ASSEMBLY, SATELLITE SERVICING, OSAM, ROBOTIC REFUELING, MICROGRAVITY MANUFACTURING, RESTORE L, ORBITAL DEBRIS REMOVAL.
In the full scope the theme holds $0.23B over 364 actions and 67 new awards. In the space only cut it holds $0.06B over 276 actions. Space only dollars in the theme were $0.00B in FY2016 and $0.00B in FY2026. In the full scope, 83.6% of new awards in the theme were competed and 4.9% of competed awards with an offer count drew a single offer (n = 41). Newer firms won 37.5% of competed new awards in the theme from FY2021 to FY2026 in the full scope, and 37.5% in the space only cut. Of the full scope actions, 1 entered the theme through the PSC rule and the rest through keywords.
Space energy and power
Rule. An action is in this theme if it carries no PSC code (none isolates this theme, so it rests on keywords alone), or if its description contains one of these phrases as whole words: SOLAR ARRAY, SOLAR ARRAYS, SPACE SOLAR, SPACE POWER, FISSION SURFACE POWER, RADIOISOTOPE, MMRTG, NUCLEAR THERMAL PROPULSION, POWER BEAMING, SOLAR ELECTRIC PROPULSION.
In the full scope the theme holds $0.44B over 1,137 actions and 219 new awards. In the space only cut it holds $0.44B over 1,130 actions. Space only dollars in the theme were $0.05B in FY2016 and $0.01B in FY2026. In the full scope, 88.1% of new awards in the theme were competed and 5.3% of competed awards with an offer count drew a single offer (n = 132). Newer firms won 33.3% of competed new awards in the theme from FY2021 to FY2026 in the full scope, and 36.4% in the space only cut. Of the full scope actions, 0 entered the theme through the PSC rule and the rest through keywords.
Ground segment and data
Rule. An action is in this theme if it carries PSC 1830, AR41, AR42, AR43, AR44, AR45, AR46, AR47, or if its description contains one of these phrases as whole words: GROUND STATION, GROUND STATIONS, GROUND SEGMENT, GROUND SYSTEM, GROUND SYSTEMS, TELEMETRY, TRACKING AND DATA, DEEP SPACE NETWORK, NEAR SPACE NETWORK, SATELLITE CONTROL NETWORK, SATELLITE OPERATIONS, MISSION OPERATIONS CENTER.
In the full scope the theme holds $19.55B over 13,320 actions and 797 new awards. In the space only cut it holds $18.07B over 12,121 actions. Space only dollars in the theme were $3.41B in FY2016 and $0.50B in FY2026. In the full scope, 27.4% of new awards in the theme were competed and 29.5% of competed awards with an offer count drew a single offer (n = 146). Newer firms won 35.7% of competed new awards in the theme from FY2021 to FY2026 in the full scope, and 0.0% in the space only cut. Of the full scope actions, 1,324 entered the theme through the PSC rule and the rest through keywords.
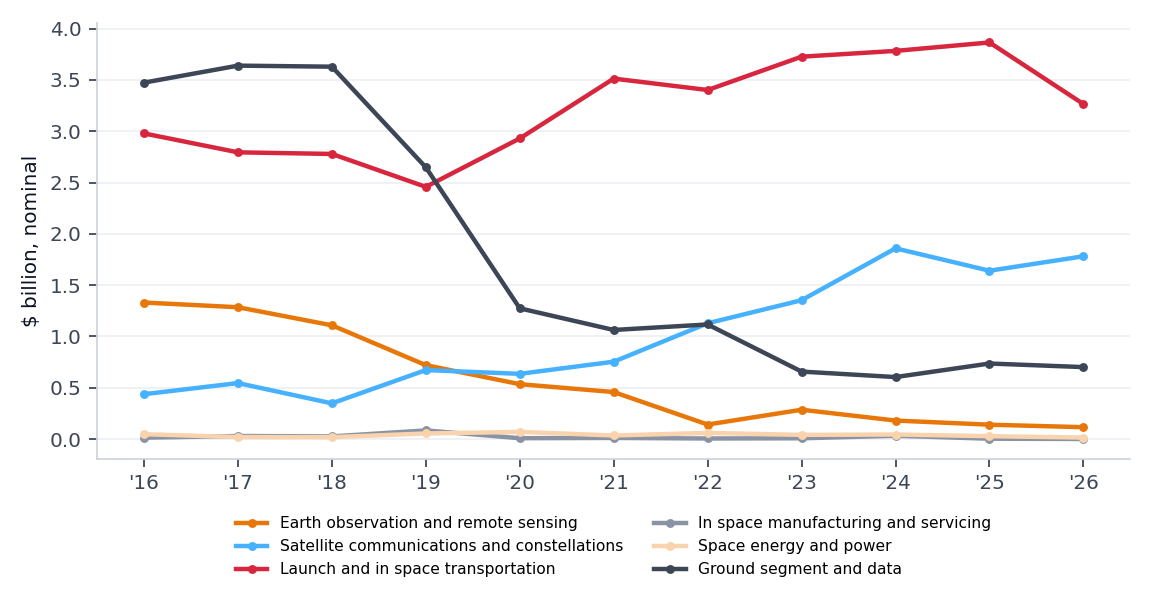
Two patterns stand out. First, the themes most discussed as growth markets are small in the federal record. In space manufacturing and servicing and space energy and power together hold $0.06B and $0.44B of space only money over eleven years. Second, ground segment work is bought with little competition: in the space only cut, 21.5% of its new awards were competed, against 79.5% for space only work overall.
11. What the record cannot show
The FPDS record is broad, but it is not the whole of federal space buying. These limits apply to every figure here.
- Classified awards are absent. Much national security space spending is classified and never reaches FPDS.
- Other transaction agreements are absent. OTAs are increasingly used for space prototypes and launch, and are not reported to FPDS.
- Grants and cooperative agreements are absent. They are a different record.
- FY2026 is incomplete. It was pulled before the Department of Defense reporting lag of up to 90 days had passed.
- Dollars are nominal. No inflation adjustment is applied, because no price index file was fetched for this study.
- Agency coded fields vary. Competition, offer counts, set asides, business size, pricing and place of performance are all entered by contracting staff.
- Vendor identity is imperfect. Parent identifiers are as recorded today; acquisitions can merge firms, and missing identifiers fall back to names.
- The full scope is not a space series. Its industry codes include missiles and communications equipment.
- Themes are keyword based. They show where words appear, not what was delivered.
- Obligations are not outlays. An obligation is a commitment to pay; payment can come years later.
The record also cannot show demand that was never placed: work an agency wanted but did not fund, or bought from its own staff. It measures transactions, not needs.
12. How this complements the supply side accounts
Two families of official work describe the space economy from the supply side. The Bureau of Economic Analysis publishes a space economy satellite account for the United States. It builds the space economy out of the national accounts: it identifies space related goods and services across industries, and reports their gross output, value added, employment and compensation, with the government's own space activity as one component. The Organisation for Economic Co-operation and Development publishes a handbook on measuring the space economy. It frames the space economy as a value chain, from upstream manufacturing and launch through downstream services that depend on space infrastructure, and sets out how countries can compile comparable statistics from national accounts, surveys and administrative data.
No figure from either source is used here. Neither file was fetched for this study, and the report does not quote their estimates.
This study is built the other way. It starts from one large buyer and counts what that buyer committed to buy, transaction by transaction. That gives four things the supply side accounts do not. It gives market structure: buyer and seller concentration, competition and pricing type. It gives timeliness: the record is public within days to months, not years. It gives auditability: every figure traces to raw records anyone can fetch. And it gives a bridge: federal purchases are a component of government spending in the national accounts, so a contract based series can, with care, be set beside the government component of a satellite account.
It also lacks things the supply side accounts have. It sees only federal buying, only unclassified contracts and only the codes chosen. It says nothing about commercial customers, exports or household use of space services. The two views are complements. Where they agree, confidence rises. Where they differ, the difference is itself a finding worth explaining.
13. Reproduction
The study can be rebuilt from public data with four commands, run in order.
- Fetch every page of the FPDS feed for each code family and fiscal year:
python3 -I bidtools/space_demand_fetch.py - Compute every metric into results.json and RESULTS.md:
python3 -I bidtools/space_demand.py - Recompute the headline figures with a second parser and check every page fingerprint:
python3 -I data/space-demand/check.py - Draw the charts and render this report:
python3 bidtools/space_report.py
The fetch log lists every page URL with its fingerprint, so a reader can confirm that a fresh pull returns the same pages for closed years. The results file, results.json, carries every figure in this report. Charts are drawn from that file and from nothing else.
Suggested citation: QuantixMind, Inc. (2026). Federal Space Demand, FY2016 to FY2026: a demand side measurement of the U.S. space economy from the contract record.
14. Appendix tables
A1. Full scope by fiscal year
| FY | actions | new awards | obligated | competed | single offer | buyer HHI |
|---|---|---|---|---|---|---|
| 2016 | 41,960 | 16,761 | $29.13B | 71.3% | 28.8% | 2,407 |
| 2017 | 49,550 | 16,877 | $27.87B | 74.3% | 25.0% | 2,533 |
| 2018 | 47,711 | 17,836 | $33.86B | 70.8% | 23.0% | 2,325 |
| 2019 | 40,573 | 13,212 | $37.21B | 78.8% | 29.4% | 2,144 |
| 2020 | 41,163 | 11,728 | $39.67B | 74.6% | 32.4% | 2,130 |
| 2021 | 37,858 | 8,562 | $33.31B | 69.7% | 34.9% | 2,243 |
| 2022 | 41,317 | 9,339 | $37.85B | 76.0% | 37.0% | 2,073 |
| 2023 | 33,673 | 7,859 | $45.08B | 70.8% | 36.1% | 2,373 |
| 2024 | 29,957 | 8,362 | $46.25B | 70.6% | 36.5% | 2,165 |
| 2025 | 28,911 | 7,308 | $51.26B | 68.1% | 35.3% | 2,170 |
| 2026 | 20,358 | 5,037 | $52.05B | 69.2% | 37.1% | 2,233 |
A2. Space only by fiscal year
| FY | actions | new awards | obligated | competed | single offer | buyer HHI |
|---|---|---|---|---|---|---|
| 2016 | 15,925 | 2,706 | $11.94B | 86.8% | 5.4% | 6,858 |
| 2017 | 16,468 | 2,751 | $11.38B | 87.5% | 8.1% | 7,290 |
| 2018 | 18,425 | 3,115 | $11.92B | 76.1% | 8.3% | 7,517 |
| 2019 | 17,437 | 2,799 | $10.78B | 85.2% | 7.1% | 8,342 |
| 2020 | 17,414 | 3,116 | $11.11B | 87.1% | 7.2% | 8,843 |
| 2021 | 15,371 | 778 | $10.74B | 55.7% | 16.0% | 8,711 |
| 2022 | 13,948 | 614 | $11.57B | 61.9% | 38.8% | 8,319 |
| 2023 | 10,531 | 600 | $12.69B | 63.4% | 26.3% | 8,077 |
| 2024 | 8,427 | 334 | $11.70B | 48.9% | 25.2% | 8,002 |
| 2025 | 8,185 | 297 | $11.69B | 41.2% | 33.8% | 8,023 |
| 2026 | 5,412 | 262 | $10.37B | 42.5% | 36.5% | 8,659 |
A3. Newer firm shares
| FY | full awards | full dollars | space awards | space dollars |
|---|---|---|---|---|
| 2021 | 21.5% | 10.5% | 24.0% | 28.3% |
| 2022 | 17.3% | 12.3% | 20.3% | 32.9% |
| 2023 | 22.4% | 8.0% | 19.5% | 64.0% |
| 2024 | 39.1% | 36.4% | 43.6% | 36.2% |
| 2025 | 40.0% | 30.1% | 48.4% | 52.4% |
| 2026 | 40.0% | 49.9% | 52.7% | 46.1% |
A4. Sellers, full scope
| FY | vendors | top seller | top five | seller HHI |
|---|---|---|---|---|
| 2016 | 3,300 | 31.1% | 67.5% | 1,435 |
| 2017 | 3,492 | 26.8% | 65.5% | 1,254 |
| 2018 | 3,273 | 27.3% | 67.2% | 1,358 |
| 2019 | 3,037 | 43.0% | 73.9% | 2,132 |
| 2020 | 2,985 | 34.3% | 69.6% | 1,558 |
| 2021 | 2,679 | 28.2% | 69.5% | 1,340 |
| 2022 | 2,544 | 29.2% | 71.9% | 1,477 |
| 2023 | 2,474 | 29.5% | 71.0% | 1,468 |
| 2024 | 2,742 | 23.1% | 56.5% | 985 |
| 2025 | 2,387 | 29.0% | 65.6% | 1,461 |
| 2026 | 1,941 | 36.1% | 74.6% | 1,873 |
A5. Set asides and small business, full scope
| FY | set aside awards | set aside $ | small business awards | small business $ |
|---|---|---|---|---|
| 2016 | 20.3% | 8.8% | 47.2% | 5.2% |
| 2017 | 21.9% | 6.0% | 48.2% | 5.6% |
| 2018 | 26.2% | 8.3% | 45.5% | 4.6% |
| 2019 | 24.8% | 5.0% | 50.4% | 4.8% |
| 2020 | 27.1% | 3.6% | 49.9% | 5.0% |
| 2021 | 19.2% | 5.8% | 58.4% | 5.2% |
| 2022 | 18.2% | 7.8% | 52.8% | 5.3% |
| 2023 | 21.0% | 2.9% | 53.9% | 4.3% |
| 2024 | 23.7% | 3.5% | 52.1% | 4.8% |
| 2025 | 23.4% | 7.9% | 57.9% | 4.2% |
| 2026 | 19.8% | 0.7% | 58.8% | 5.8% |
A6. Award size, full scope
| FY | new awards | median | 90th pct | over $100M | $ over $100M |
|---|---|---|---|---|---|
| 2016 | 16,575 | $16,240 | $253,776 | 5 | 16.1% |
| 2017 | 16,657 | $14,940 | $250,000 | 11 | 44.0% |
| 2018 | 17,673 | $14,851 | $250,123 | 11 | 36.9% |
| 2019 | 13,043 | $30,398 | $479,816 | 15 | 46.8% |
| 2020 | 11,419 | $45,445 | $609,450 | 13 | 59.7% |
| 2021 | 8,210 | $22,279 | $510,446 | 12 | 45.7% |
| 2022 | 9,103 | $14,310 | $381,867 | 11 | 35.6% |
| 2023 | 7,638 | $25,502 | $612,045 | 17 | 63.7% |
| 2024 | 8,204 | $23,294 | $744,898 | 22 | 67.6% |
| 2025 | 7,145 | $26,381 | $705,781 | 15 | 53.0% |
| 2026 | 4,760 | $27,808 | $816,140 | 19 | 74.1% |
A7. Place of performance, full scope
| FY | top state | share | top ten | state HHI | not reported |
|---|---|---|---|---|---|
| 2016 | CA | 25.1% | 84.5% | 1,384 | 6.7% |
| 2017 | CA | 25.6% | 84.2% | 1,359 | 6.0% |
| 2018 | CA | 20.8% | 86.6% | 1,321 | 3.8% |
| 2019 | TX | 27.5% | 87.6% | 1,483 | 2.7% |
| 2020 | TX | 25.2% | 84.5% | 1,278 | 3.3% |
| 2021 | AZ | 15.6% | 84.7% | 1,082 | 3.4% |
| 2022 | TX | 19.0% | 87.7% | 1,239 | 4.1% |
| 2023 | TX | 21.2% | 84.8% | 1,222 | 4.3% |
| 2024 | AZ | 16.8% | 83.6% | 1,142 | 4.9% |
| 2025 | AZ | 20.1% | 85.8% | 1,337 | 4.2% |
| 2026 | TX | 27.5% | 90.3% | 1,522 | 4.2% |
| state | share of dollars, all years |
|---|---|
| TX | 20.0% |
| CA | 15.4% |
| AZ | 15.3% |
| FL | 10.8% |
| CO | 5.1% |
| AL | 4.9% |
| UT | 4.0% |
| MA | 3.9% |
| MD | 3.0% |
| VA | 2.9% |
A8. Pricing groups, full scope
| FY | fixed price | cost type | other |
|---|---|---|---|
| 2016 | 52.5% | 44.0% | 3.5% |
| 2017 | 53.1% | 43.3% | 3.6% |
| 2018 | 59.1% | 37.9% | 3.0% |
| 2019 | 63.8% | 33.1% | 3.1% |
| 2020 | 64.4% | 32.6% | 2.9% |
| 2021 | 60.4% | 37.0% | 2.7% |
| 2022 | 57.1% | 40.9% | 2.0% |
| 2023 | 63.4% | 35.2% | 1.4% |
| 2024 | 64.8% | 34.3% | 0.9% |
| 2025 | 68.7% | 30.4% | 0.8% |
| 2026 | 71.8% | 27.7% | 0.5% |
A9. Agency dollars, full scope
| FY | NASA | Dept. of the Army | Dept. of the Air Force |
|---|---|---|---|
| 2016 | $11.40B | $5.16B | $5.15B |
| 2017 | $11.22B | $5.77B | $3.73B |
| 2018 | $11.74B | $8.81B | $4.51B |
| 2019 | $10.77B | $10.04B | $4.23B |
| 2020 | $11.37B | $10.85B | $4.75B |
| 2021 | $11.10B | $7.27B | $6.48B |
| 2022 | $11.65B | $7.43B | $7.67B |
| 2023 | $12.47B | $13.74B | $9.78B |
| 2024 | $11.80B | $11.42B | $11.76B |
| 2025 | $12.07B | $15.20B | $9.89B |
| 2026 | $12.06B | $16.09B | $11.27B |
| FY | Dept. of the Navy | Missile Defense Agency (MDA) | Defense Information Systems Agency (DISA) | All other |
|---|---|---|---|---|
| 2016 | $4.28B | $1.81B | $0.45B | $0.88B |
| 2017 | $4.80B | $0.90B | $0.47B | $0.98B |
| 2018 | $5.09B | $2.17B | $0.67B | $0.87B |
| 2019 | $7.02B | $3.57B | $0.58B | $1.01B |
| 2020 | $7.40B | $3.21B | $0.63B | $1.48B |
| 2021 | $5.36B | $1.29B | $0.72B | $1.08B |
| 2022 | $5.65B | $3.87B | $0.61B | $0.98B |
| 2023 | $6.40B | $0.95B | $0.62B | $1.12B |
| 2024 | $7.13B | $1.78B | $0.81B | $1.54B |
| 2025 | $9.49B | $2.12B | $0.77B | $1.72B |
| 2026 | $8.20B | $2.52B | $0.22B | $1.69B |
A10. Themes, full scope
Earth observation and remote sensing
| FY | obligated | actions | new awards | competed | single offer | newer firm |
|---|---|---|---|---|---|---|
| 2016 | $1.33B | 1,720 | 324 | 92.0% | 4.3% | n/a |
| 2017 | $1.29B | 1,899 | 366 | 92.1% | 2.8% | n/a |
| 2018 | $1.11B | 2,108 | 336 | 87.2% | 2.3% | n/a |
| 2019 | $0.72B | 1,671 | 200 | 84.5% | 0.0% | n/a |
| 2020 | $0.54B | 1,439 | 111 | 94.6% | 9.1% | n/a |
| 2021 | $0.46B | 1,091 | 13 | 84.6% | 66.7% | 27.3% |
| 2022 | $0.14B | 514 | 12 | 75.0% | 33.3% | 11.1% |
| 2023 | $0.29B | 364 | 15 | 80.0% | 33.3% | 16.7% |
| 2024 | $0.18B | 235 | 5 | 40.0% | 100.0% | 0.0% |
| 2025 | $0.14B | 228 | 10 | 30.0% | 100.0% | 0.0% |
| 2026 | $0.12B | 146 | 8 | 50.0% | 66.7% | 50.0% |
Satellite communications and constellations
| FY | obligated | actions | new awards | competed | single offer | newer firm |
|---|---|---|---|---|---|---|
| 2016 | $0.44B | 1,602 | 796 | 94.2% | 4.6% | n/a |
| 2017 | $0.55B | 6,649 | 1,363 | 96.6% | 3.2% | n/a |
| 2018 | $0.35B | 3,478 | 1,410 | 93.0% | 10.8% | n/a |
| 2019 | $0.67B | 1,809 | 1,003 | 92.6% | 27.8% | n/a |
| 2020 | $0.64B | 848 | 271 | 71.0% | 25.6% | n/a |
| 2021 | $0.75B | 1,375 | 568 | 57.1% | 52.5% | 19.4% |
| 2022 | $1.13B | 3,549 | 1,798 | 88.2% | 45.8% | 9.0% |
| 2023 | $1.35B | 3,360 | 1,207 | 80.3% | 54.0% | 17.4% |
| 2024 | $1.86B | 3,955 | 2,064 | 78.8% | 60.3% | 55.5% |
| 2025 | $1.64B | 3,136 | 1,267 | 67.9% | 53.5% | 74.9% |
| 2026 | $1.78B | 2,425 | 938 | 58.8% | 65.4% | 79.4% |
Launch and in space transportation
| FY | obligated | actions | new awards | competed | single offer | newer firm |
|---|---|---|---|---|---|---|
| 2016 | $2.98B | 565 | 70 | 81.4% | 2.3% | n/a |
| 2017 | $2.79B | 573 | 60 | 85.0% | 0.0% | n/a |
| 2018 | $2.78B | 568 | 47 | 91.5% | 4.3% | n/a |
| 2019 | $2.46B | 515 | 35 | 80.0% | 0.0% | n/a |
| 2020 | $2.93B | 538 | 28 | 64.3% | 0.0% | n/a |
| 2021 | $3.51B | 543 | 17 | 70.6% | 10.0% | 33.3% |
| 2022 | $3.40B | 514 | 4 | 0.0% | n/a | n/a |
| 2023 | $3.73B | 429 | 12 | 58.3% | 16.7% | 0.0% |
| 2024 | $3.78B | 391 | 7 | 57.1% | 0.0% | 25.0% |
| 2025 | $3.87B | 460 | 17 | 82.4% | 0.0% | 64.3% |
| 2026 | $3.27B | 435 | 11 | 54.5% | 0.0% | 66.7% |
In space manufacturing and servicing
| FY | obligated | actions | new awards | competed | single offer | newer firm |
|---|---|---|---|---|---|---|
| 2016 | $0.01B | 15 | 9 | 77.8% | 0.0% | n/a |
| 2017 | $0.03B | 36 | 11 | 100.0% | 0.0% | n/a |
| 2018 | $0.03B | 51 | 14 | 100.0% | 8.3% | n/a |
| 2019 | $0.08B | 57 | 10 | 80.0% | 0.0% | n/a |
| 2020 | $0.01B | 43 | 11 | 72.7% | 14.3% | n/a |
| 2021 | $0.01B | 46 | 6 | 66.7% | 0.0% | 75.0% |
| 2022 | $0.01B | 35 | 4 | 75.0% | n/a | 0.0% |
| 2023 | $0.01B | 28 | 1 | 100.0% | n/a | 0.0% |
| 2024 | $0.03B | 24 | 1 | 0.0% | n/a | n/a |
| 2025 | $0.00B | 19 | 0 | n/a | n/a | n/a |
| 2026 | $0.00B | 10 | 0 | n/a | n/a | n/a |
Space energy and power
| FY | obligated | actions | new awards | competed | single offer | newer firm |
|---|---|---|---|---|---|---|
| 2016 | $0.05B | 136 | 53 | 98.1% | 2.7% | n/a |
| 2017 | $0.02B | 133 | 45 | 97.8% | 6.1% | n/a |
| 2018 | $0.02B | 167 | 45 | 88.9% | 4.0% | n/a |
| 2019 | $0.05B | 147 | 26 | 80.8% | 15.4% | n/a |
| 2020 | $0.07B | 140 | 27 | 88.9% | 0.0% | n/a |
| 2021 | $0.04B | 117 | 7 | 57.1% | 0.0% | 25.0% |
| 2022 | $0.06B | 98 | 4 | 75.0% | 0.0% | 33.3% |
| 2023 | $0.04B | 57 | 3 | 33.3% | n/a | 0.0% |
| 2024 | $0.04B | 70 | 6 | 66.7% | 25.0% | 50.0% |
| 2025 | $0.03B | 42 | 1 | 0.0% | n/a | n/a |
| 2026 | $0.01B | 30 | 2 | 0.0% | n/a | n/a |
Ground segment and data
| FY | obligated | actions | new awards | competed | single offer | newer firm |
|---|---|---|---|---|---|---|
| 2016 | $3.47B | 2,448 | 135 | 38.5% | 27.0% | n/a |
| 2017 | $3.64B | 2,446 | 124 | 33.1% | 34.6% | n/a |
| 2018 | $3.63B | 2,723 | 240 | 17.1% | 29.2% | n/a |
| 2019 | $2.65B | 2,160 | 88 | 34.1% | 38.5% | n/a |
| 2020 | $1.27B | 953 | 52 | 23.1% | 25.0% | n/a |
| 2021 | $1.06B | 766 | 38 | 26.3% | 40.0% | 50.0% |
| 2022 | $1.12B | 584 | 29 | 21.4% | 16.7% | 16.7% |
| 2023 | $0.66B | 355 | 22 | 22.7% | 60.0% | 0.0% |
| 2024 | $0.60B | 286 | 26 | 19.2% | 0.0% | 80.0% |
| 2025 | $0.74B | 384 | 36 | 38.9% | 14.3% | 35.7% |
| 2026 | $0.70B | 215 | 7 | 28.6% | 50.0% | 0.0% |
A4. Sellers, space only
| FY | vendors | top seller | top five | seller HHI |
|---|---|---|---|---|
| 2016 | 1,047 | 23.4% | 64.4% | 1,125 |
| 2017 | 1,096 | 20.7% | 63.8% | 1,062 |
| 2018 | 1,145 | 22.7% | 62.5% | 1,010 |
| 2019 | 1,130 | 24.1% | 62.8% | 1,108 |
| 2020 | 1,162 | 23.3% | 58.2% | 944 |
| 2021 | 959 | 21.2% | 59.0% | 929 |
| 2022 | 878 | 22.4% | 61.7% | 980 |
| 2023 | 725 | 21.8% | 59.2% | 936 |
| 2024 | 756 | 11.2% | 44.2% | 528 |
| 2025 | 589 | 19.6% | 56.6% | 858 |
| 2026 | 454 | 20.4% | 57.4% | 895 |
A5. Set asides and small business, space only
| FY | set aside awards | set aside $ | small business awards | small business $ |
|---|---|---|---|---|
| 2016 | 68.0% | 46.4% | 26.4% | 5.7% |
| 2017 | 71.8% | 70.3% | 27.3% | 6.2% |
| 2018 | 83.8% | 73.4% | 25.8% | 6.0% |
| 2019 | 87.9% | 38.9% | 28.2% | 7.7% |
| 2020 | 83.8% | 29.6% | 27.6% | 9.5% |
| 2021 | 26.7% | 10.9% | 21.6% | 8.1% |
| 2022 | 24.3% | 35.5% | 18.6% | 7.9% |
| 2023 | 24.3% | 2.7% | 19.0% | 6.4% |
| 2024 | 14.5% | 12.7% | 27.2% | 6.1% |
| 2025 | 19.4% | 49.3% | 28.6% | 6.7% |
| 2026 | 7.4% | 9.1% | 26.3% | 10.9% |
A6. Award size, space only
| FY | new awards | median | 90th pct | over $100M | $ over $100M |
|---|---|---|---|---|---|
| 2016 | 2,684 | $121,256 | $691,705 | 0 | 0.0% |
| 2017 | 2,727 | $123,446 | $609,032 | 0 | 0.0% |
| 2018 | 3,101 | $118,641 | $744,134 | 1 | 12.1% |
| 2019 | 2,778 | $123,152 | $748,306 | 1 | 26.6% |
| 2020 | 3,096 | $124,590 | $747,419 | 1 | 16.5% |
| 2021 | 739 | $122,356 | $1,195,000 | 0 | 0.0% |
| 2022 | 595 | $137,331 | $1,058,452 | 0 | 0.0% |
| 2023 | 588 | $178,721 | $984,299 | 1 | 45.0% |
| 2024 | 311 | $252,254 | $2,000,000 | 0 | 0.0% |
| 2025 | 286 | $245,525 | $2,000,000 | 0 | 0.0% |
| 2026 | 254 | $403,250 | $7,156,098 | 0 | 0.0% |
A7. Place of performance, space only
| FY | top state | share | top ten | state HHI | not reported |
|---|---|---|---|---|---|
| 2016 | CA | 40.8% | 89.0% | 2,422 | 4.7% |
| 2017 | CA | 43.8% | 88.6% | 2,579 | 4.8% |
| 2018 | CA | 40.8% | 88.8% | 2,241 | 4.1% |
| 2019 | CA | 33.6% | 83.8% | 1,739 | 6.1% |
| 2020 | CA | 32.8% | 83.5% | 1,713 | 6.5% |
| 2021 | CA | 33.8% | 84.2% | 1,816 | 7.5% |
| 2022 | CA | 38.2% | 84.5% | 2,227 | 9.8% |
| 2023 | CA | 39.4% | 81.3% | 2,421 | 13.0% |
| 2024 | CA | 34.5% | 78.8% | 2,168 | 16.8% |
| 2025 | CA | 33.1% | 80.5% | 2,055 | 16.0% |
| 2026 | CA | 31.2% | 80.7% | 2,039 | 15.8% |
| state | share of dollars, all years |
|---|---|
| CA | 36.7% |
| CO | 10.6% |
| AL | 10.4% |
| TX | 6.9% |
| MD | 6.7% |
| VA | 4.4% |
| WA | 2.1% |
| FL | 2.1% |
| UT | 1.6% |
| AZ | 1.2% |
A8. Pricing groups, space only
| FY | fixed price | cost type | other |
|---|---|---|---|
| 2016 | 9.2% | 82.8% | 8.0% |
| 2017 | 9.2% | 82.3% | 8.5% |
| 2018 | 8.3% | 83.5% | 8.2% |
| 2019 | 7.7% | 81.9% | 10.4% |
| 2020 | 13.3% | 76.6% | 10.1% |
| 2021 | 17.0% | 75.1% | 7.9% |
| 2022 | 16.4% | 77.4% | 6.2% |
| 2023 | 19.4% | 76.1% | 4.5% |
| 2024 | 20.3% | 76.3% | 3.4% |
| 2025 | 16.5% | 80.1% | 3.4% |
| 2026 | 18.6% | 79.4% | 2.0% |
A9. Agency dollars, space only
| FY | NASA | Dept. of the Air Force | Dept. of the Navy |
|---|---|---|---|
| 2016 | $9.66B | $2.17B | $0.11B |
| 2017 | $9.56B | $1.73B | $0.08B |
| 2018 | $10.23B | $1.56B | $0.13B |
| 2019 | $9.82B | $0.79B | $0.16B |
| 2020 | $10.44B | $0.58B | $0.07B |
| 2021 | $10.02B | $0.64B | $0.07B |
| 2022 | $10.51B | $0.95B | $0.08B |
| 2023 | $11.34B | $1.22B | $0.10B |
| 2024 | $10.40B | $1.17B | $0.09B |
| 2025 | $10.43B | $1.08B | $0.10B |
| 2026 | $9.64B | $0.57B | $0.06B |
| FY | Energy, Department of | Federal Acquisition Service | Defense Microelectronics Activity (DMEA) | All other |
|---|---|---|---|---|
| 2016 | $0.00B | $0.00B | $0.01B | $-0.02B |
| 2017 | $0.00B | $0.00B | $0.00B | $0.00B |
| 2018 | $0.00B | $0.00B | $0.01B | $-0.01B |
| 2019 | $0.00B | $0.00B | $0.01B | $0.00B |
| 2020 | $0.01B | $0.00B | $0.00B | $-0.00B |
| 2021 | $0.02B | $-0.00B | $0.00B | $-0.00B |
| 2022 | $0.03B | $0.00B | $0.00B | $-0.00B |
| 2023 | $0.03B | $0.00B | $0.00B | $-0.00B |
| 2024 | $0.04B | $0.00B | $0.00B | $0.00B |
| 2025 | $0.04B | $0.06B | $0.00B | $-0.01B |
| 2026 | $0.04B | $0.07B | $0.00B | $-0.01B |
A10. Themes, space only
Earth observation and remote sensing
| FY | obligated | actions | new awards | competed | single offer | newer firm |
|---|---|---|---|---|---|---|
| 2016 | $0.96B | 1,615 | 314 | 92.4% | 0.0% | n/a |
| 2017 | $0.97B | 1,803 | 358 | 93.6% | 0.0% | n/a |
| 2018 | $0.74B | 2,004 | 333 | 87.4% | 2.4% | n/a |
| 2019 | $0.46B | 1,606 | 198 | 85.4% | 0.0% | n/a |
| 2020 | $0.33B | 1,392 | 108 | 96.3% | 0.0% | n/a |
| 2021 | $0.39B | 1,047 | 10 | 90.0% | 0.0% | 22.2% |
| 2022 | $0.13B | 472 | 8 | 87.5% | 100.0% | 0.0% |
| 2023 | $0.23B | 330 | 11 | 81.8% | n/a | 11.1% |
| 2024 | $0.15B | 219 | 4 | 50.0% | 100.0% | 0.0% |
| 2025 | $0.12B | 212 | 6 | 33.3% | n/a | 0.0% |
| 2026 | $0.09B | 130 | 4 | 50.0% | 100.0% | 50.0% |
Satellite communications and constellations
| FY | obligated | actions | new awards | competed | single offer | newer firm |
|---|---|---|---|---|---|---|
| 2016 | $0.32B | 192 | 42 | 90.5% | 0.0% | n/a |
| 2017 | $0.35B | 224 | 38 | 100.0% | 0.0% | n/a |
| 2018 | $0.15B | 229 | 35 | 85.7% | 9.1% | n/a |
| 2019 | $0.10B | 207 | 28 | 85.7% | 0.0% | n/a |
| 2020 | $0.04B | 127 | 7 | 71.4% | 0.0% | n/a |
| 2021 | $0.00B | 86 | 1 | 0.0% | n/a | n/a |
| 2022 | $0.01B | 49 | 8 | 75.0% | 20.0% | 16.7% |
| 2023 | $0.02B | 54 | 7 | 71.4% | 33.3% | 40.0% |
| 2024 | $0.06B | 45 | 1 | 100.0% | 100.0% | 100.0% |
| 2025 | $0.08B | 68 | 1 | 100.0% | n/a | 100.0% |
| 2026 | $0.07B | 42 | 2 | 0.0% | n/a | n/a |
Launch and in space transportation
| FY | obligated | actions | new awards | competed | single offer | newer firm |
|---|---|---|---|---|---|---|
| 2016 | $1.25B | 388 | 56 | 78.6% | 0.0% | n/a |
| 2017 | $1.28B | 401 | 50 | 88.0% | 0.0% | n/a |
| 2018 | $1.41B | 357 | 42 | 90.5% | 4.5% | n/a |
| 2019 | $1.77B | 348 | 33 | 78.8% | 0.0% | n/a |
| 2020 | $2.28B | 376 | 28 | 64.3% | 0.0% | n/a |
| 2021 | $2.66B | 397 | 13 | 61.5% | 14.3% | 37.5% |
| 2022 | $2.49B | 373 | 4 | 0.0% | n/a | n/a |
| 2023 | $2.82B | 303 | 8 | 37.5% | 0.0% | 33.3% |
| 2024 | $2.75B | 289 | 5 | 40.0% | 0.0% | 50.0% |
| 2025 | $2.42B | 352 | 3 | 0.0% | n/a | n/a |
| 2026 | $2.12B | 333 | 5 | 0.0% | n/a | n/a |
In space manufacturing and servicing
| FY | obligated | actions | new awards | competed | single offer | newer firm |
|---|---|---|---|---|---|---|
| 2016 | $0.00B | 13 | 8 | 87.5% | 0.0% | n/a |
| 2017 | $0.01B | 28 | 10 | 100.0% | 0.0% | n/a |
| 2018 | $0.00B | 40 | 14 | 100.0% | 8.3% | n/a |
| 2019 | $0.03B | 47 | 10 | 80.0% | 0.0% | n/a |
| 2020 | $0.01B | 38 | 11 | 72.7% | 14.3% | n/a |
| 2021 | $0.00B | 37 | 6 | 66.7% | 0.0% | 75.0% |
| 2022 | $0.00B | 30 | 4 | 75.0% | n/a | 0.0% |
| 2023 | $0.00B | 22 | 1 | 100.0% | n/a | 0.0% |
| 2024 | $0.00B | 5 | 0 | n/a | n/a | n/a |
| 2025 | $0.00B | 8 | 0 | n/a | n/a | n/a |
| 2026 | $0.00B | 8 | 0 | n/a | n/a | n/a |
Space energy and power
| FY | obligated | actions | new awards | competed | single offer | newer firm |
|---|---|---|---|---|---|---|
| 2016 | $0.05B | 136 | 53 | 98.1% | 2.7% | n/a |
| 2017 | $0.02B | 133 | 45 | 97.8% | 6.1% | n/a |
| 2018 | $0.02B | 167 | 45 | 88.9% | 4.0% | n/a |
| 2019 | $0.05B | 142 | 23 | 82.6% | 0.0% | n/a |
| 2020 | $0.07B | 139 | 27 | 88.9% | 0.0% | n/a |
| 2021 | $0.04B | 117 | 7 | 57.1% | 0.0% | 25.0% |
| 2022 | $0.06B | 97 | 3 | 66.7% | 0.0% | 50.0% |
| 2023 | $0.04B | 57 | 3 | 33.3% | n/a | 0.0% |
| 2024 | $0.04B | 70 | 6 | 66.7% | 25.0% | 50.0% |
| 2025 | $0.03B | 42 | 1 | 0.0% | n/a | n/a |
| 2026 | $0.01B | 30 | 2 | 0.0% | n/a | n/a |
Ground segment and data
| FY | obligated | actions | new awards | competed | single offer | newer firm |
|---|---|---|---|---|---|---|
| 2016 | $3.41B | 2,357 | 107 | 30.8% | 5.6% | n/a |
| 2017 | $3.54B | 2,363 | 99 | 26.3% | 9.1% | n/a |
| 2018 | $3.52B | 2,637 | 212 | 11.3% | 33.3% | n/a |
| 2019 | $2.48B | 2,071 | 66 | 28.8% | 0.0% | n/a |
| 2020 | $1.12B | 826 | 27 | 29.6% | n/a | n/a |
| 2021 | $0.87B | 615 | 3 | 33.3% | 0.0% | 0.0% |
| 2022 | $1.00B | 475 | 4 | 0.0% | n/a | n/a |
| 2023 | $0.55B | 240 | 3 | 33.3% | 0.0% | 0.0% |
| 2024 | $0.47B | 181 | 0 | n/a | n/a | n/a |
| 2025 | $0.60B | 214 | 0 | n/a | n/a | n/a |
| 2026 | $0.50B | 142 | 0 | n/a | n/a | n/a |
A11. Top five vendor keys, all years
| view | vendor key (as recorded) | share of dollars |
|---|---|---|
| full scope | Lockheed Martin Corporation | 30.8% |
| full scope | Raytheon Company | 8.0% |
| full scope | Northrop Grumman Systems Corporation | 6.7% |
| full scope | Boeing Company, The | 6.2% |
| full scope | Raytheon Company | 6.1% |
| space only | NASA laboratory operator (FFRDC) | 16.8% |
| space only | The Boeing Company | 13.2% |
| space only | Lockheed Martin Corporation | 11.0% |
| space only | Northrop Grumman Systems Corporation | 7.9% |
| space only | NASA laboratory operator (FFRDC) | 4.6% |
A12. Source
FPDS public ATOM feed, https://www.fpds.gov/ezsearch/FEEDS/ATOM?FEEDNAME=PUBLIC, one query per code family and fiscal year. 41,887 pages, fetched 2026-10-13T20:07:11Z to 2026-10-13T21:02:44Z. Fetch log SHA256 482c82273d505c39417c3d9fe9f1c9b3e75ab0c38e488f71b04ff41856b5c7ab. No other file was fetched.